WebQuest
How To Teach English With Technology
Task

Method
Subjects
The test subjects were all students of English at the Faculty of Education, Bergen University College (HiB), either in their first, or their third or fourth year. For each group there were 26 respondents, 52 in total. The students were, for the purposes of this study, classified as �new� in the case of the first-year students, and �experienced� in the case of the third or fourth year students. Such a classification is of course not exhaustive, and students in the �new� group might conceivably have considerable experience before starting their first semester at HiB. However, a difference in mean age between the two groups (2.5 years) does indicate that the �experienced� group on the whole is somewhat older (mean age experienced students: 24.0 years, mean age new students: 21.5 years); the difference is statistically significant with a Welch t-test ( = 2.22, p = 0.03). In other words, there is a small, but real, age difference between the two groups, which can reasonably be interpreted as a consequence of the additional amount of higher education taken by the �experienced� group. Thus, given the difference between the groups, we would also expect systematic differences with respect to attitudes and skills. Both groups of students were following broadly similar courses in English, although at a different pace and with some differences with respect to how the course modules were organized. Another potential confounding factor is that the �new� students attended a program aimed at primary school, whereas the �experienced� students attended a program aimed at primary as well as lower secondary school. The effects of these factors are discussed in the analysis section.
Data collection
The data was collected by means of a questionnaire in two separate sessions, one for each group. Each respondent was asked to assess his or her own IT skills in general, as with respect to using the Web, and with respect to using office type software. For general IT skills and Web skills, the distribution of responses was more or less identical (see distribution for Web skills in figure 2). The distribution of office-software skills was somewhat different, as seen in figure 2. Furthermore, the students were asked to indicate the approximate number hours they had spent using a computer during the last 7 days, in addition to their attitude toward teaching with technology (websites, programs, online data etc.), both in general and in English. Finally, they were asked to supply their age, sex, and native language (with the exception of four students in the �experienced� group, all reported Norwegian as their native language). All the assessments (with the exception of the number of hours spent using a computer) were done using a 5-point scale, where 1 was low (�not useful�, �poor skills�) and 5 was high (�very useful�, �excellent skills�).
The main trends in the data are presented in figures 1 and 2. Figure 1 shows that attitudes toward teaching English with technology are, on the whole, positive (median 4), and that there is no clear correlation with either age or the number of hours spent on computer use. Figure 2 shows reported IT skills and attitudes to teaching English with technology broken down by group. Although �new� students report somewhat higher general IT skills, no dramatic differences between the groups present themselves in any of the plots. However, students appear to rate their office software skills lower than other IT skills.
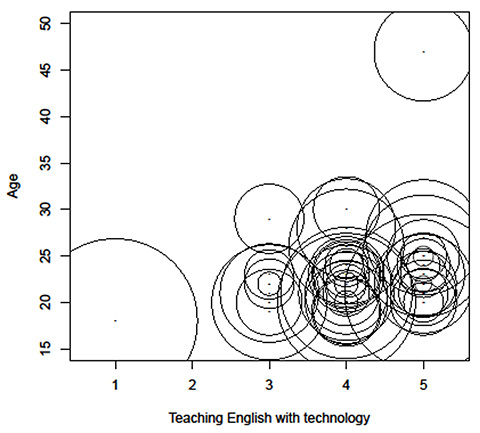
Figure 1: Bubbleplot showing attitudes toward teaching English with technology (horizontal axis) plotted against age of respondent (vertical axis). [i]

Figure 2: Reported IT skills by group (�new� and �experienced�), with added non-parametric regression lines. [ii]

Figure 3: Student teachers are more confident in their Web skills than in their office-type software skills. [iii]
Hypothesis
The hypothesis to be tested was that the more experienced students held the use of electronic resources in teaching in higher regard than the less experienced students. Although there was a clear age difference between the groups, it seems unlikely that this difference would be large enough to give rise to any general age-related differences in attitude to, or skills in, computer use. For all practical purposes these students must be considered to belong to the same age cohort with respect to their E-savviness. Consequently, it was predicted that any differences that might arise between the two groups would be due to the more extensive training which the more experienced students had received during their enrollment in the teacher training program.
Analyses
Three parallel strategies were pursued in trying to measure the differences between the two groups with respect to attitudes and self-reported skills. First, initial testing for group differences was carried out by means of standard statistical tests for differences between groups or conditions with respect to IT skills. Second, ordinal regression was used to estimate the influence each variable had on attitudes toward teaching with technology. Finally, a visualization technique called Multidimensional Scaling (MDS) was used to reduce the variation in the dataset to a two-dimensional plot of distances, which essentially clusters responses together based on shared characteristics including ratings and variables. See Venables and Ripley (2002) for details on these two latter methods. All statistical tests were computed with the open-source statistical software package R (R Development Core Team, 2010), using general functions and the following user-supplied libraries: Design (Harrell, 2009); MASS (Venables & Ripley, 2002). In all statistical tests, the conventional alpha level of 0.05 was used to determine statistical significance.
Possible differences in IT skills and attitudes
Figure 2 indicated that the two student groups on the whole rated their IT skills similarly. This impression is supported by a Friedman rank sum test showing that the differences between the two groups in terms of the three types of self-reported IT skills (general, office-software, and Web) are not significant (Friedman = 3.71, p = 0.16) . The lower right plot of figure 2 furthermore suggests that the two groups of students do not differ in their attitudes toward teaching English with technology, and this is supported by the non-significant result of a Wilcoxon / Mann-Whitney test (W = 320.5, p = 0.74). Despite this lack of group differences, it would appear from figure 2 that office type IT skills are rated lower by all students. Figure 3 plots the overall ratings of office type and Web skills, respectively. It seems clear from the plot that students rate their office software IT skills lower. This difference (tested for Web-skills and office-type skills) was found to be statistically significant with a Wilcoxon signed rank test for paired samples (V = 334, p = 0.02). Hence it seems warranted to conclude that, contrary to the initial hypothesis, new and more experienced students do not differ in their reported IT skills, but that all students in the sample are less confident in their office software skills in they are in their other IT skills.
Predicting attitudes: Ordinal regression
Despite the lack of differences between the two student groups with respect to IT skills and attitudes toward teaching English with technology, there might be other sources of variation in the data. Two such sources are age and sex. The age of respondents ranges from 18 to 47, and 44 out of the 52 respondents are female. Although it would be possible to conduct a number of separate hypothesis tests on these variables with respect to attitudes toward teaching with technology, it is no desirable for two reasons. First, several related tests on the same data would increase the risk of spuriously significant results. Second, it would be interesting to investigate whether all these variables interact or influence each other in systematic ways, while at the same time measuring their correlation with attitudes to teaching with technology. To achieve this, an ordinal regression model was used to estimate the effect of the variables Study program, Age,Sex, General IT skills, Web skills, Office software skills, Hours spent using a computer, on attitudes to teaching English with technology. Although some of these variables were shown to be uncorrelated with the attitudes in isolation, they were included in the model to estimate any potential interaction effects between them.
The dependent variable in the model was the self-reported attitudes to teaching English with technology. These were ratings on an ordinal scale, and the model calculated the odds that the attitude of a given respondent was a given rating or higher, based on a linear combination of the independent variables, or predictors, mentioned above. The model indicated that none of these variables were statistically significant, i.e. that despite having information about all or any of these variables, the model does no better at predicting the students� attitudes to teaching with technology than it would if it had been guessing at random. Furthermore, there were no significant interaction effects between any of the variables. This strongly suggests that there are no systematic correlations between any of these variables and attitude towards teaching English with technology among the students in the sample.
The full picture: Multidimensional scaling
The conclusion in the previous paragraph is further strengthened through a multidimensional scaling (MDS) map. MDS is a technique for reducing the variation among observations on an ordinal scale to a structure which is suitable for representing as points in a two-dimensional plot, allowing us to interpret distances between points. Figure 4 shows an MDS map for the two groups of students with respect to the three categories of IT skills, as well as attitudes toward using technology in teaching English, as well as in teaching in general (the number of hours spent on computer use was removed to ensure a better representation). As the plot clearly shows, the two groups are more or less identical, despite some outliers. Had there been systematic differences between the groups, they would have formed separate clusters in the plot. The structure revealed in figure 4 indicates that for all practical purposes the two groups are identical with respect to attitudes and self-reported skills.
Interim summary
The present section has demonstrated that there are no discernable differences in skills and attitudes between the two groups of students. Despite both a significant difference in the time spent in the teacher training program and some differences in the aims of the programs (primary school only versus primary and lower secondary school), the two groups of students consistently rate teaching English with technology as something positive, and they consistently rate their office software skills lower than other IT related skills. Possible confounding factors such as age, sex, or hours spent using a computer were not found to be significant predictors of student attitudes. The MDS map in figure 4 shows that despite their differences, the new and the more experienced student groups overlap to such an extent that it is not possible to distinguish them based on attitudes to teaching English with technology or self-reported IT skills. Based on this, it seems that the initial hypothesis, namely that the more experienced students have heightened their skills in and attitudes to teaching with technology, can be rejected. This conclusion is based on several different statistical techniques, which suggests that the results are reliable. However, a significant difference was found with respect to self-reported IT skills: all students tended to rate their office software skills lower than their Web skills. The next section will consider the effect of the experiment involving demonstrating Web-based software to the students.

Figure 4: MDS map showing the two groups of students (�New� and �Experienced�) with respect to self-assessed E-skills and attitudes towards using E-resources in teaching.[iv]
Intervention: animated bubbles on the Web
The other main question this study attempted to answer was whether the students might change their attitudes towards teaching with technology if they were given a demonstration of such resources in use. Such an effect would not be entirely unexpected, as it could be a learning effect. Of course, it would be na�ve to expect attitudes (the phenomenon being measured) to change in the course of one lecture. However, it does reflect fairly well the actual teaching conditions. Time is always at a premium in teaching, and it is not uncommon for a lecturer to only have one or two lectures at his or her disposal to cover a given topic. Hattie (2009, pp. 220-221) reports an average medium sized learning effect of computer assisted instruction which is unrelated to the duration of the instruction itself. Hence, the learning effect (if any) of an exposure to a single, brief instance of E-learning is not entirely unrealistic, nor is it without interest.
Teaching English history with animated graphs
After the student teachers had completed the first part of the survey (reported on above), they sat through a teaching session on English political and social history. The session consisted of the following elements: a brief traditional, introductory lecture, a set of tasks related to English history for in-class work in pairs, and finally a demonstration using online data and software. The intention behind the demonstration using online data was two-fold. The first goal was to use available statistical data as a means of teaching English history. Although numbers might seem dry, they do provide a valuable and interesting complement to prose narrative as a source of information about the past, if presented in an appropriate way. Furthermore, reading and creating graphs and working with numbers are skills that are now integrated in several subjects in the LK06, including English (Ministry of Education and Research, 2006). The second aim was to investigate whether such a demonstration might positively influence attitudes toward using teaching English with technology.
For the purposes of this demonstration, a website was constructed displaying an animated graph which maps the relationship between population size, wheat prices, and wages for two different groups of workers in England between 1259 and 1750. The raw data for this demonstration are freely available from a website maintained by the Dutch International Institute of Social History(http://www.iisg.nl/hpw/data.php). The software for creating the animated graph is a freeware implementation of the �bubbleplot� software created by the Gapminder organization for displaying health and economics data (http://www.gapminder.org/world). The original Gapminder data can only display the data already entered into their databases. However, the Google Docs office suite supports a freeware implementation in the form of plugin to their spreadsheet software. With this web-based software it is fairly easy to create such animated graphics for any dataset and to publish it on the Web. Figure 5 shows a screenshot of the graph. The full animated graph created for the purposes of the current study can be accessed athttp://home.hib.no/ansatte/gbj/population.htm.

Figure 5: Screenshot of an animated graph displaying the interaction between population size, wheat prices, and wages for two categories of employees (farm workers and building craftsmen) in England between 1259 and 1750. [v]
The Public URL for this WebQuest:
http://zunal.com/webquest.php?w=249083
WebQuest Hits: 2,653
Save WebQuest as PDF


